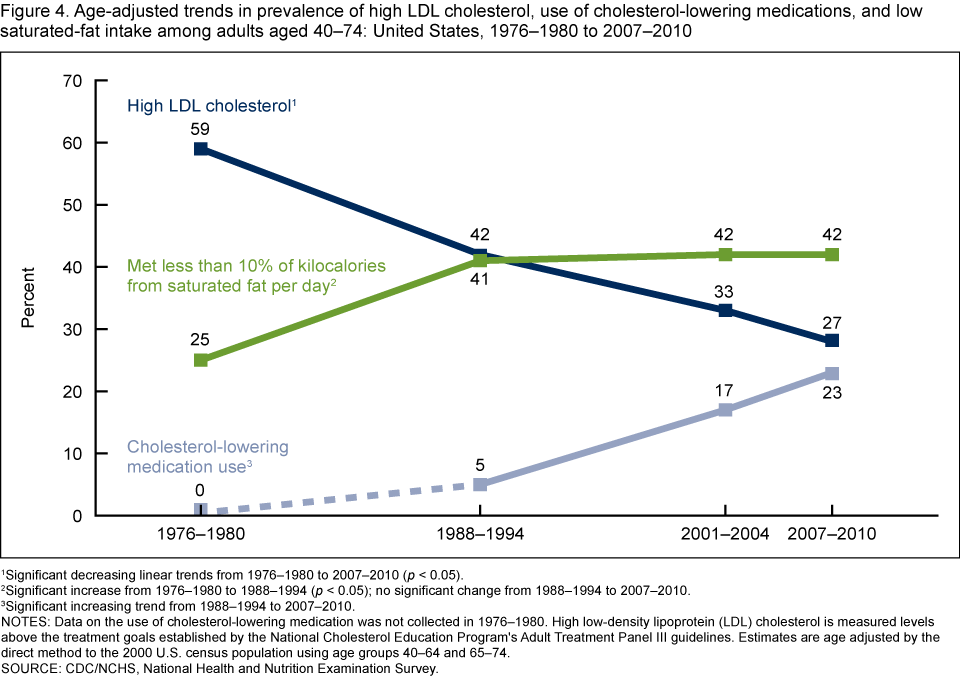
And the trend continues not only for diet but for exercise too...
This analysis followed ~28,000 U.S. adults for more than 10 years. They found the calorie intake by statin users increased by 9.6% and the fat intake increased by 14.4%, while neither of these changed significantly among those not on statins during that same time period. The increase of BMI was faster for statin-users than for non-users.
In Health
Jeff
Is There Gluttony in the Time of Statins? Different Time Trends of Caloric and Fat Intake between Statin-users and Non-users among US Adults
JAMA Intern Med. 2014 Jul; 174(7): 1038–1045.
doi: 10.1001/jamainternmed.2014.1927
PMCID: PMC4307794
NIHMSID: NIHMS647022
https://www.ncbi.nlm.nih.gov/pmc/articles/PMC4307794/Abstract
Importance
Both dietary modification and statins can lower blood cholesterol. The increase in caloric intake among general population is reported to have plateaued in the last decade, but no study has examined the relationship between the time trends of caloric intake and statin use.
Objective
To examine the difference in the temporal trends of caloric and fat intake between statin-users and non-users among US adults.
Design
A repeated cross-sectional study.
Setting
A nationally representative sample of the National Health and Nutrition Examination Survey from 1999 through 2010.
Participants
27,886 US adults aged 20 years or older.
Exposure
Statin use.
Main Outcomes and Measures
Caloric and fat intake measured through 24-hour dietary recall. Generalized linear models with interaction term between survey cycle and statin use were constructed to investigate the time trends of dietary intake for statin-users and non-users after adjustment for possible confounders. We calculated model-adjusted caloric and fat intake using these models, and examined if the time trends differ by statin use. Body mass index (BMI) changes were also compared between statin-users and non-users.
Results
In 1999-2000, the caloric intake was significantly less for statin-users compared with non-users (2,000 vs. 2,179 kcal/day, p=.007). The difference between the groups became smaller as time went by, and there was no statistical difference after 2005-2006. Among statin-users, caloric intake in 2009-2010 was 9.6% higher (95% confidence interval (CI): 1.8 to 18.1, p=.02) than that in 1999-2000. In contrast, no significant change was observed among non-users during the same study period. Statin-users also consumed significantly less fat in 1999-2000 (71.7 vs. 81.2 g/day, p=.003). Fat intake increased 14.4% in statin-users (95% CI: 3.8 to 26.1, p=.007) while not changing significantly in non-users. BMI also increased more in statin-users (1.3 kg/m2) than non-users (0.4 kg/m2) in the adjusted model (p=.02).
Conclusions and Relevance
Caloric and fat intake have increased among statin-users over time, which was not true for non-users. The increase of BMI was faster for statin-users than for non-users. Efforts aimed at dietary control among statin-users may be becoming less intensive. The importance of dietary composition may need to be reemphasized for statin-users.
on Exercise
Same for exercise
Comparing the Trend of Physical Activity and Caloric Intake between Lipid-Lowering Drug Users and Nonusers among Adults with Dyslipidemia: Korean National Health and Nutrition Examination Surveys (2010–2013)
Korean J Fam Med. 2016 Mar; 37(2): 105–110.
Published online 2016 Mar 25. doi: 10.4082/kjfm.2016.37.2.105
PMCID: PMC4826989
Abstract
Background
The purpose of this study was to compare the physical activity and caloric intake trends of lipid-lowering drug users with those of non-users among Korean adults with dyslipidemia.
Methods
This study was a repeated cross-sectional study with a nationally representative sample of 2,635 Korean adults with dyslipidemia based on the 2010–2013 Korea National Health and Nutrition Examination Survey. Physical activity was assessed using the International Physical Activity Questionnaire, and caloric intake was estimated through 24-hour dietary recall. All statistical analyses were conducted using IBM SPSS ver. 21.0 (IBM Co., Armonk, NY, USA). The changes in physical activity and caloric intake were investigated for lipid-lowering drug users and non-users using generalized linear models.
Results
The proportion of lipid-lowering drug users in the 2010–2013 survey population increased from 3.5% to 5.0% (P<0.001). Among adults of dyslipidemia, total of 1,562 participants (56.6%) reported taking lipid-lowering drugs, and 1,073 (43.4%) reported not taking lipid-lowering drugs. Drug users were more likely to be older and less educated and to have a diagnosis of diabetes, higher body mass index, and lower low density lipoprotein cholesterol level. Physical activity trends were tested separately for the lipid-lowering drug users and non-users, and a significant decrease was found among the drug users during the study period. Physical activity among the drug users in 2013 was 38% lower (1,357.3±382.7 metabolic equivalent [MET]; P for trend=0.002) than in 2010 (2,201.4±442.6 MET). In contrast, there was no statistically significant difference between drug users and non-users in the trend of caloric intake during the same period.
Conclusion
Physical activity significantly decreased among lipid-lowering drug users between 2010 and 2013, which was not observed among non-users. The importance of physical activity may need to be re-emphasized for lipid-lowering drug users.


